



A Modern Guide to Digital Ad Attribution in 2026
Why the 2020 Measurement Playbook Is Officially Dead
If you’ve felt like your campaign reports tell a different story than your sales team, you’re not imagining it.
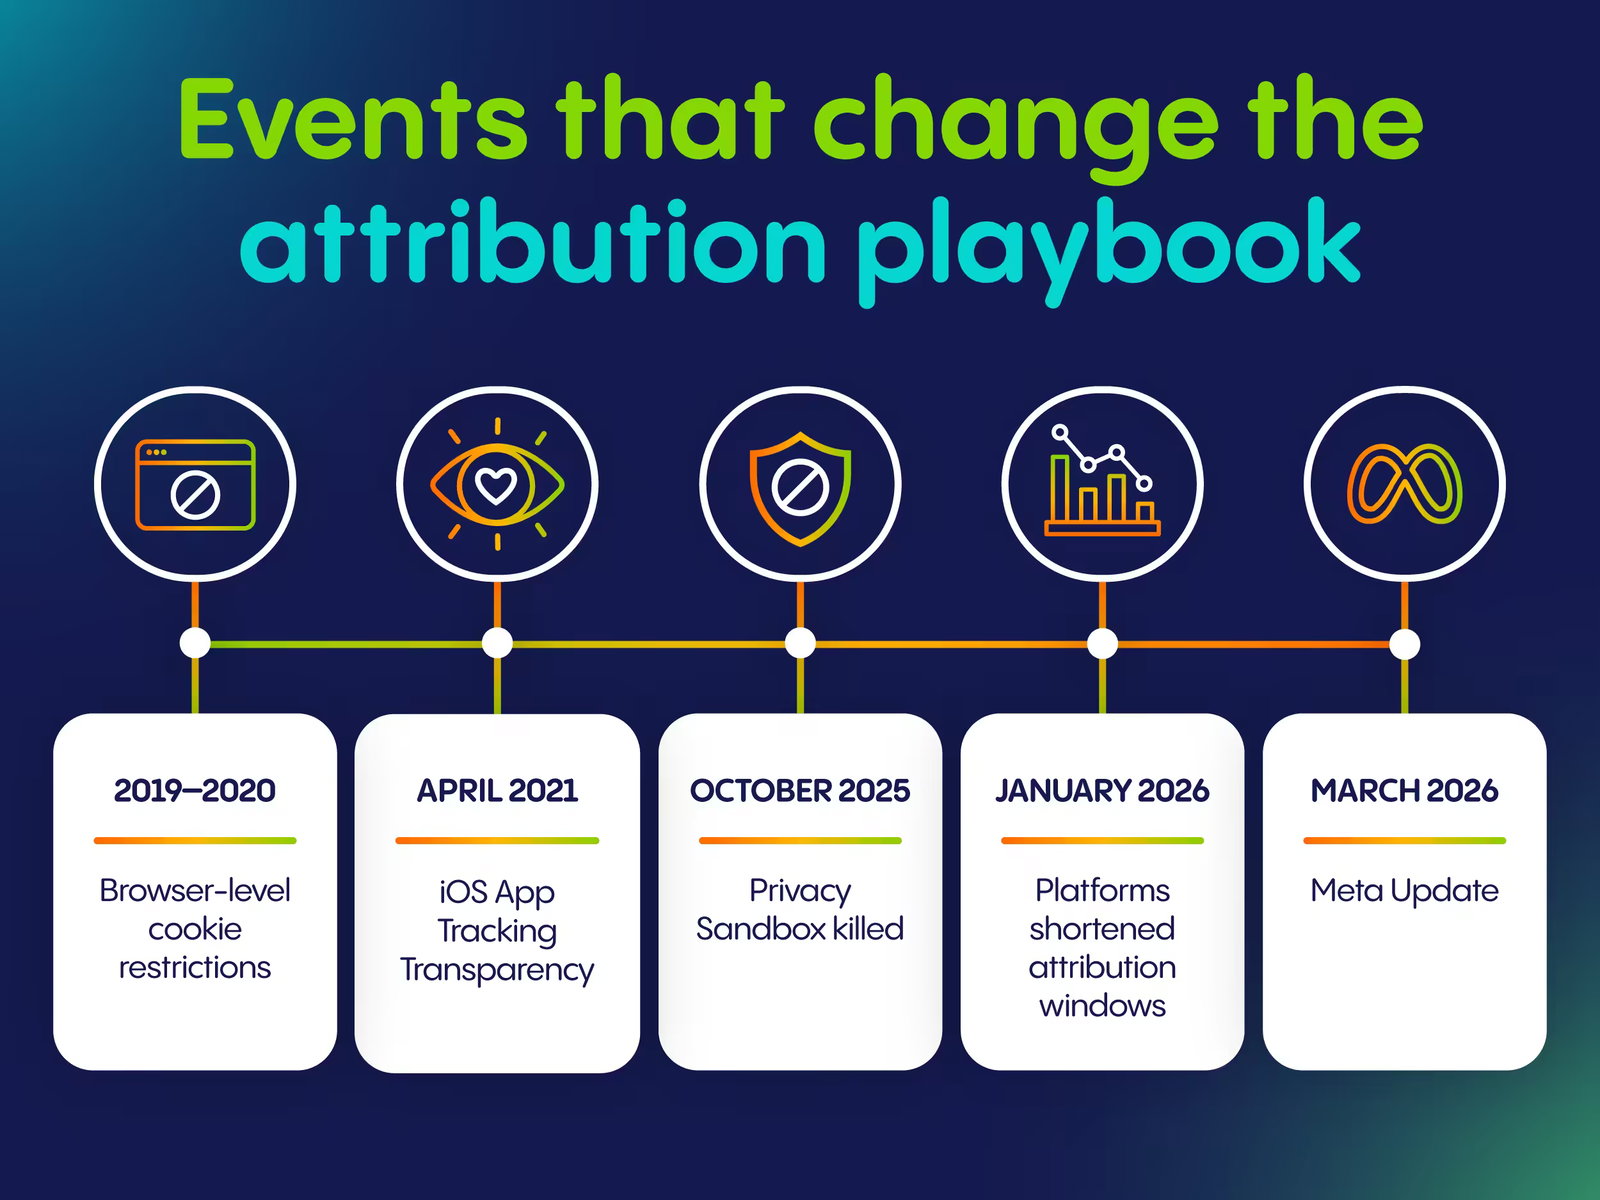
The way we measured digital advertising five years ago no longer works. Four discrete events between 2021 and 2026 invalidated the old playbook, and most marketers are still building budgets like nothing has changed:
| When | What changed | What it broke |
| 2019–2020 | Browser-level cookie restrictions | Safari and Firefox already block third-party cookies by default. ~30%+ of browsers were already cookieless before Chrome’s saga. |
|---|---|---|
| April 2021 | iOS App Tracking Transparency | Apple required apps to ask for tracking permission. ~75% of users said no. Meta lost a huge chunk of deterministic signal overnight. |
| 2019–2020 | Browser-level cookie restrictions | Safari and Firefox already block third-party cookies by default. ~30%+ of browsers were already cookieless before Chrome’s saga. |
| October 2025 | Privacy Sandbox killed | Google deprecated all 10 remaining Privacy Sandbox APIs after CMA testing showed 85% attribution inaccuracy. No replacement coming. |
| January 2026 | Platforms shortened attribution windows | Meta removed 7-day view entirely. Default is now 7-day click, 1-day view, punishing view-through awareness. |
| March 2026 | Meta Update | Click-through redefined to link-clicks only plus the new engage-through bucket separately measures conversions influenced by actions |
The result is that marketers are making bigger and bigger budget decisions on smaller and smaller slices of truth. Algorithms train on incomplete data. Sales teams credit “the website” while paid media takes the blame for “low quality leads.” And finance is asking the question every CMO dreads: “Can you actually prove what these ads are doing?”
The good news: a more accurate, more durable measurement model exists. It just requires letting go of last-click GA4 thinking and adopting the framework today’s best agencies are already running.
The takeaway up front: Measurement isn’t math, it’s judgment. The numbers will never perfectly agree. The marketer’s job is to know why they disagree, which one to trust for which decision, and how to translate that into clear recommendations.
Measurement vs. Attribution vs. Analytics: Three Words People Use Interchangeably (And Shouldn’t)
Most marketers use these three terms as if they mean the same thing. They don’t, and the distinction is foundational to everything else.
- Measurement: Did it happen? The act of tracking that an event occurred (a click, a view, a form fill). Just the count. No interpretation.
- Attribution: What caused it? The act of assigning credit for a conversion across the channels and touchpoints that influenced it. Always a model. Always a choice.
- Analytics: What does it mean? The interpretation layer. Combining measurement plus attribution with business context to make decisions. GA4 is one tool, not the answer.
When a stakeholder says they want “better attribution,” sometimes they actually mean better measurement. Or better analytics. Knowing which is the difference between a useful conversation and a frustrating one.
FYI: Meta saying “50 conversions” is measurement. Meta saying “I drove these 50 conversions” is attribution. Saying “we should cut Meta” is analytics. They are three different jobs.
How Conversions Actually Get Counted in 2026
Most numbers in your Ads Manager today are not what you think they are. There are three ways platforms count a conversion, and only one of them is a 1:1 fact.
| Type | What it is | Example |
| Deterministic | 1:1 user match. A logged-in user, a hashed email, or a click ID. The platform knows for certain that user X did action Y. The gold standard, and the smallest bucket of data we have left. | A user logged into Facebook clicked an ad and bought. |
| Probabilistic | Statistical match across devices and sessions using IP, device fingerprint, browsing patterns. Higher volume than deterministic, but inferred and not certain. Increasingly restricted by privacy. | Same IP, same browser version, same session window = probably the same person. |
| Modeled | AI-filled estimates. The platform doesn’t know what happened, so it estimates using machine learning trained on similar users who did consent. Meta and Google fill in the gaps this way and don’t tell you which numbers are modeled. | iOS user who didn’t consent, Meta models what they probably did. |
Critical reality check: Meta does not flag which conversions in your dashboard are modeled. They’re all just there, mixed together. If you can’t tell deterministic from modeled in your reporting, you can’t accurately read the dashboard.
Click-Through vs. View-Through
There’s also the question of what counted as influence in the first place.
- Click-through (CTC): the user clicked the ad and converted within the window. Strong causal signal. Treats the ad as the cause. As of March 2026, only link clicks count as click-through on Meta, everything else moved to engage-through.
- View-through (VTC): the user saw the ad, didn’t click, but converted later through another path. Weak signal. Easy to inflate. “Saw” can mean one second of partial visibility.
The rule we operate by: trust click-through for direct response. Discount view-through heavily. Use view-through for awareness and brand campaigns where it actually means something.
Did you know? Across the major platforms, attribution windows are wildly different. Meta defaults to 7-day click, 1-day engage-through, 1-day view. Google Ads defaults to data-driven across a 30-day click window (configurable up to 90). TikTok mirrors Meta. GA4 defaults to a 30-day acquisition window. Same conversion, different lenses, different “answers.”
The Six Attribution Models and What GA4 Will Actually Let You Pick
Once you know the basics of how conversions get counted, the next layer is how credit gets assigned across a multi-touch journey. Six models matter:
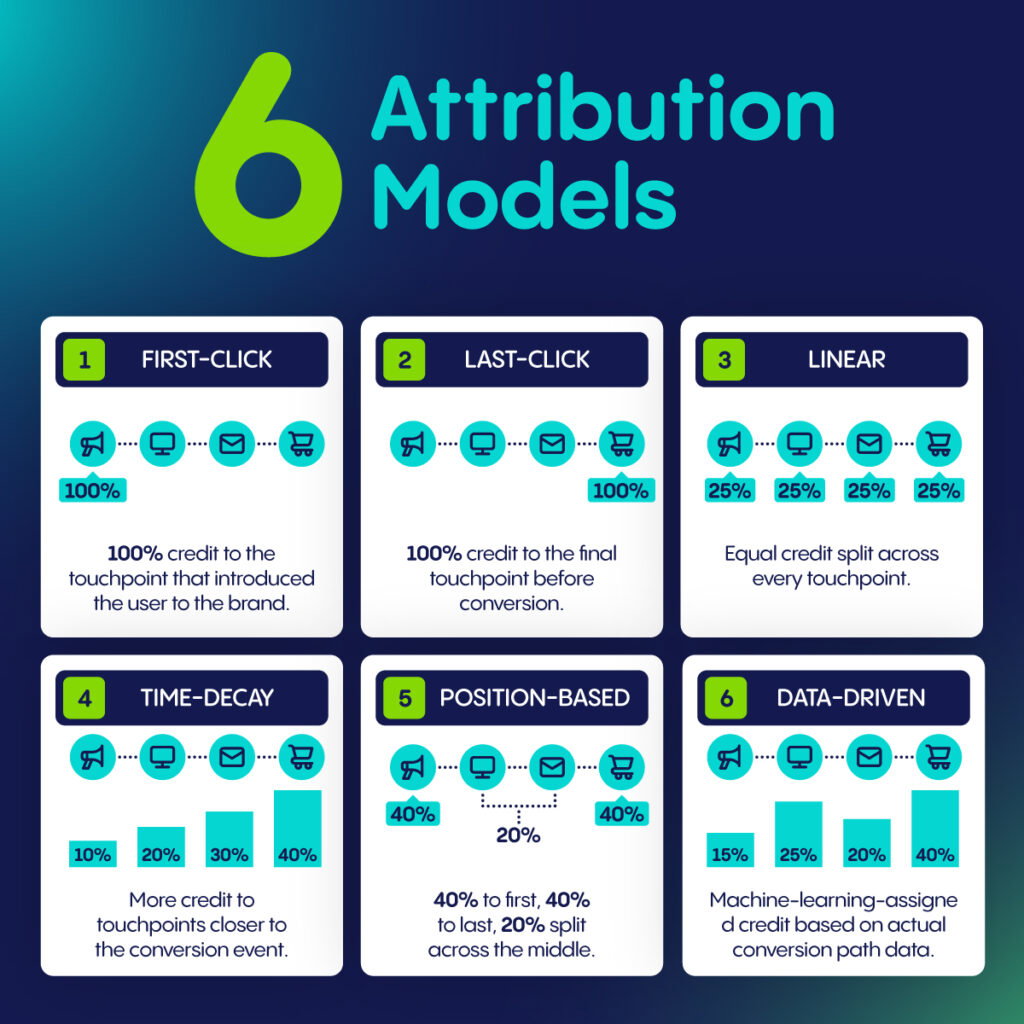
- First-click: 100% credit to the touchpoint that introduced the user to the brand.
- Last-click: 100% credit to the final touchpoint before conversion.
- Linear: Equal credit split across every touchpoint.
- Time-decay: More credit to touchpoints closer to the conversion event.
- Position-based (U-shaped): 40% to first, 40% to last, 20% split across the middle.
- Data-driven (DDA): Machine-learning-assigned credit based on actual conversion path data.
Each one tells the truth in some scenarios and lies in others.
| Model | Tells the truth when… | Lies when… |
| First-click | Measuring awareness or demand creation | Used as the only model for direct response because it punishes the channel that closed the deal |
| Last-click | Capture demand: branded search, retargeting, anything where the user already knew you | Evaluating upper-funnel channels like Display, CTV, awareness Meta. They all get 0% credit even when they did the work |
| Linear | Reporting to stakeholders who want to see every channel contribute | Making real budget decisions which treats a $0.10 Display impression and a $40 brand search click as equally valuable |
| Time-decay | Short-cycle decisions like e-commerce or trial signups, where recency genuinely correlates with influence | Long sales cycles where the awareness ad happened weeks before the close, burying top-of-funnel work |
| Position-based | Full-funnel campaigns where the intro and the close both clearly matter | Long, high-touch journeys where a mid-funnel demo, sales call, or email sequence actually carried the deal |
| Data-driven (DDA) | High-volume accounts where the algorithm has enough signal to learn real influence patterns | Low-volume accounts because GA4 silently falls back to last-click without telling you |
The DDA Trap Almost Nobody Talks About
Data-driven attribution is GA4’s default and the best model on paper but only when it actually runs. Here’s the part most marketers don’t realize:
GA4 needs 400+ conversions per key event AND 20,000 total in the lookback window for DDA to actually activate. Below those thresholds, GA4 silently reverts to last-click. The dashboard still looks like DDA. It isn’t.
For most local-service businesses, regional retailers, and anyone outside high-volume e-commerce, DDA almost certainly isn’t running. You can audit it under Admin → Property → Attribution Settings in GA4.
What GA4 Even Lets You Pick in 2026
This is the reality check almost no one is told: as of November 2023, GA4 deprecated first-click, linear, time-decay, position-based, and ad-preferred models. Inside GA4 itself, only data-driven and last-click are still selectable.
Those four deprecated models still matter as analytical concepts and other tools (HubSpot, Triple Whale, Northbeam) still expose them. But if you’re relying on GA4 alone, you’re choosing between DDA (when you have volume) or last-click. That’s it.
The Principle: Match the Model to the Channel’s Job
There is no single “right” model. The right model depends on what question you’re trying to answer.
| Funnel position | Best lens | Examples |
| Top: awareness, demand creation | First-click | Display, CTV, YouTube, awareness Meta |
| Middle: consideration, nurture | Linear / time-decay / position-based | Mid-funnel Meta, retargeting display, email |
| Bottom: conversion, capture | Last-click | Branded search, retargeting, capture demand |
| Full funnel | Data-driven (when you have volume) | Multi-channel programs with 400+ conversions |
The next time a stakeholder asks which model to use, the right counter-question is: which question are you trying to answer?
The Three Layers of Measurement, Ranked by Trust
Once you know how conversions get counted and which models to apply, the next discipline is knowing which data source to trust for which decision.
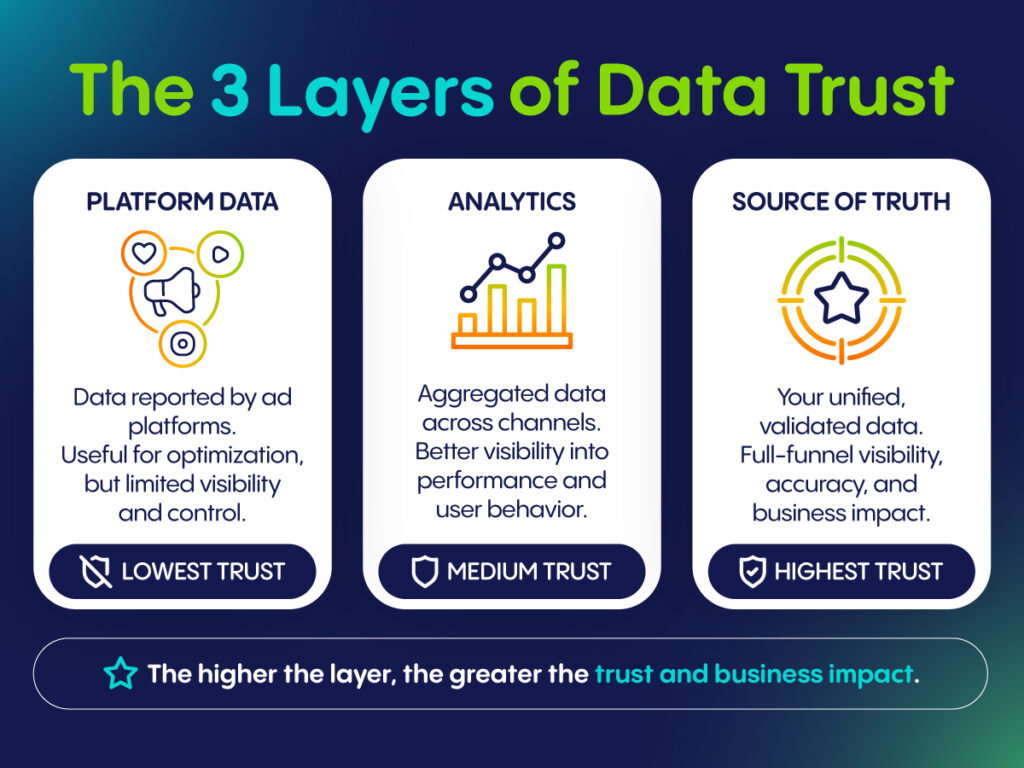
We organize every client engagement around three layers, ranked in inverse order of trust:
| Layer | Source | Best for | Watch out for |
| 1. Platform Data (lowest trust) | Meta Ads Manager, Google Ads, TikTok Ads | In-platform optimization, learning phase decisions, creative testing | Biased toward itself. Each platform claims credit it didn’t earn. Never use as the source of truth. |
| 2, Analytics (medium trust) | GA4, third-party attribution tools | Channel mix decisions, journey analysis, comparing paid vs. organic | Lossy from cookie restrictions. DDA threshold issues. Modeled conversions filling gaps. |
| 3. Source of Truth (highest trust) | Client CRM, revenue, qualified-lead data | Budget decisions, channel kill/scale calls, ROAS reporting | Lacks attribution context because the CRM doesn’t know which channel drove the lead unless we feed it back. |
The shorthand: platform data is for optimization. CRM is for decisions.
A Worked Triangulation Example
Imagine a real scenario. A client’s Meta dashboard shows 80 leads at $40 CPL. GA4 shows 52 conversions from Meta. The CRM shows 31 qualified leads. The client wants to cut Meta by 50%.
What do you tell them?
| Source | What it shows | What it really means |
| Meta: 80 leads | 7-day click window credits leads even when the user returns days later via direct/organic. Plus form spam, duplicates, modeled iOS conversions. | Most inflated number. Fine for in-platform optimization, useless for budget decisions. |
| GA4: 52 conversions | Last-click within session. Same user clicks Meta Tuesday, returns direct Friday, GA4 tags it as direct, not Meta. Loses ITP/ad-blocker traffic. | Closer to real but undercounts Meta’s true influence. |
| CRM: 31 qualified leads | Real humans the sales team can call. Blind to the journey but truthful on revenue. | The number we make budget decisions on. True cost-per-qualified-lead = $103. |
The recommendation: Don’t cut Meta. The numbers don’t disagree because of a problem; they disagree because they’re answering different questions. The CRM is the only one anchored to revenue, and at $103 per qualified lead, the channel is performing.
The action item, though, is just as important: feed the CRM data back to Meta so the algorithm starts learning what real qualified leads look like. That’s the hybrid model.
The Hybrid Fix: Server-Side Tracking + CRM Match-Back
Knowing the framework is half the battle. Building the infrastructure to act on it is the other half.
The fix is a hybrid measurement model: two reinforcing layers that, together, recover the conversion picture pixels alone can’t.
Layer 1: Server-Side Tracking via CAPI
Server-side tracking moves your conversion events out of the browser and routes them through a server you control before they’re sent to ad platforms. That one shift solves a long list of problems at once:
- Bypasses ad blockers and ITP. Server calls aren’t blocked by browser tracking prevention or ad blockers the way pixels are.
- Works regardless of ATT consent. iOS users who opted out are no longer invisible.
- Sends hashed first-party data (email, phone, click IDs like fbclid) so platforms can match conversions to real users with much higher confidence.
- Captures CRM events such as qualified leads, closed deals, in-store sales, that pixels can never see.
Did you know? Server-side tracking via CAPI typically recovers 60–75% of attribution accuracy that pixel-only setups lose. That’s roughly 30 points of accuracy back, per account.
Layer 1 + Layer 2 = Our Standard Stack: Server-side Tracking + Platform-Native APIs
Our infrastructure layer uses a server-side Google Tag Manager host that powers CAPI, Enhanced Conversions, and TikTok Events API across every paid client account. We use architecture because it offers native integrations with the major platforms, runs on a custom subdomain so it looks like first-party traffic (no ad blocker triggers), and ships with pre-built tags that compress setup time.
Here’s how data moves through it:
- Client website event fires. A user submits a form, calls, or converts.
- Sent to a server-side container on a custom subdomain so it looks like first-party traffic.
- The server-side tracking forwards to platforms like Meta CAPI, Google Enhanced Conversions, TikTok Events API.
- CRM enrichment for qualified leads and closed deals are pushed back to the platforms as offline events.
Step 4 is where the magic is. We’re not just tracking conversions; we’re feeding the algorithm what actually became revenue.
Why CRM Match-Back Closes the Loop
Server-side tracking fixes what’s leaking from your website. But for many businesses, a meaningful share of the buyer journey happens off the website entirely – phone calls, sales appointments, in-store purchases, contracts signed days or weeks later.
That’s where CRM match-back comes in. On a recurring cadence (daily, weekly, monthly), conversion data is pushed straight from your CRM, POS, or sales system back into your ad accounts. You’re telling Meta, Google, and the programmatic ecosystem: “Here’s who actually became a customer. Optimize toward more people like them.”
The match is done on hashed first-party identifiers These are the same emails and phone numbers your sales team already collects, so it’s privacy-safe and platform-supported.
Beyond Attribution: Incrementality and MMM
Even a well-built hybrid attribution stack can’t answer one critical question: “Would we have gotten this conversion anyway?”
Attribution tells you who got credit. Incrementality tells you what would have happened without the ad. They’re different questions, and any serious modern measurement program runs both.
| Test type | How it works | Best for |
| Geo lift tests | Run ads in test geos. Hold out control geos. Measure the conversion lift difference. | Branded campaigns, awareness, CTV. Clients with multi-state or multi-DMA presence. |
| Conversion lift studies | Meta and Google offer this natively. Auto-randomized exposed vs. holdout groups. | Clients with significant spending on a single platform. |
| Holdout tests | Pause the channel for 30–60 days. Measure conversion baseline. Compare to active period. | Any time you’re considering killing or scaling a channel. |
The next time a channel “looks like it isn’t converting,” the right first move is a 30-day holdout test, not a budget cut. The channel that looks weak on attribution may be doing the awareness work that lets your bottom-funnel channels close.
For larger advertisers running offline channels (TV, radio, OOH, direct mail), marketing mix modeling (MMM) adds a third layer. MMM is top-down statistical regression that estimates each channel’s true contribution over time.
Build a Future-Proof Measurement Stack with Uniquely Digital
Measurement and attribution aren’t going to get easier. Browsers will keep tightening. Privacy laws will keep stacking. Platforms will keep shortening windows. Algorithms will keep relying more, not less, on the conversion data you choose to send them.
The brands that win the next decade are the ones building durable measurement infrastructure right now. That’s where Uniquely Digital comes in.
Our hybrid approach is built on four pillars:
- Razor-sharp audience targeting powered by exclusive first- and third-party data sets.
- Tailored media planning across Meta, TikTok, YouTube, Google, X, Pinterest, CTV/Streaming TV, Display/programmatic, Streaming Audio, Email & SMS, and emerging channels.
- Digital-first creative designed for each channel, audience, and stage of the funnel.
- Continual measurement and attribution via server-side tracking, CRM match-back, and incrementality testing, so every campaign is accountable to real revenue, not vanity metrics.
FYI: Uniquely Digital connects 1 billion data points to 230 million real people to build high converting audiences pushed directly to ad platforms like Meta and YouTube for focused and targeted campaigns. This allows us to close the loop and more effectively measure attribution by connecting ad engagement audiences to offline sales.
The outcome? No wasted budgets. No more arguing about lead quality. Honest channel attribution. And the kind of clarity that turns marketing from a cost center into a profit engine.
Proof and Case Studies
Case Study: Paid Social Strategy Drives Mardi Gras Ticket Sales

For seasonal events, success is decided long before the gates open. Mardi Gras Galveston needed to maximize ticket sales within a short buying window while competing against countless regional entertainment options fighting for the same audience attention and discretionary spend.
Uniquely Digital used a Meta-only strategy, server-side tracking, and net-new audience targeting to drive a 302% increase in ticket revenue and a 16.6x ROAS for Mardi Gras Galveston on a flat budget.
Case Study: Multi-store Furniture Retailer Hits Record Holiday Sales

See how a regional furniture brand grew sales 25% YoY over July 4th, earning national recognition with a winning digital strategy.
In a fiercely competitive retail market, our client, a leading Houston-based furniture retailer with eight locations, achieved an impressive 25% year-over-year (YoY) sales growth during its 2025 July 4th promotion. The campaign was so successful that it earned national recognition in Furniture Today, highlighting our client as a standout in the industry.
Ready to plug the leaks in your tracking and finally see what your ads are really doing?